- Smart Home Products and Services
- Global Connected Living
- Residential Security
- Broadband and Entertainment Services
- Smart Energy Management
- CE Devices and Mobility
- Wellness and Independent Living
- Entertainment Content
Consumer Research
Primary ResearchSubscribe TodayThe Parks Points newsletter features all aspects of our research, including smart home, IoT devices, entertainment and digital media, security, energy, health, and consumer data. Subscribe Now | Churn and Retention of OTT Video Services
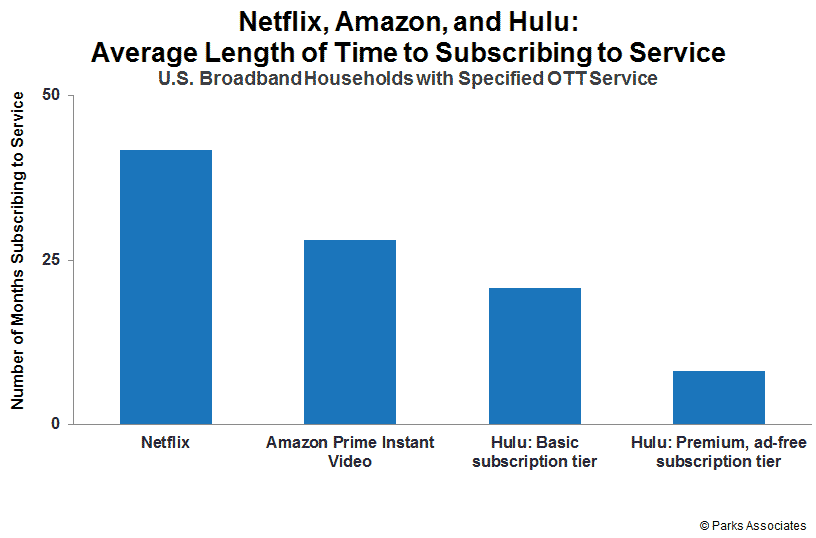
Download Table of Contents (PDF) Overview of OTT Service Subscriptions Overall OTT Service Subscriptions (2013 - 2017) Overall OTT Service Subscriptions by Generation (2015 - 2017) Top OTT Service Subscriptions (2012 - 2017) Sports OTT Video Subscription (2016 - 2017) Methods of Subscribing to OTT Services (Q1/17) Multi-subscription Households Number of OTT Service Subscriptions (2014 - 2017) Numbers of OTT Services Subscribed Among Subscribers (2016 - 2017) Numbers of OTT Services Subscribed by Generations (2016 - 2017) Recent Use of Transactional or Ad-supported OTT Services by OTT Subscription Holders (Q1/17) Characteristics of OTT Subscription Households Top OTT Service Subscriptions by Generations (Q1/17) Top OTT Service Subscriptions by Technology Adoption Segment (Q1/17) Overall OTT Service Subscriptions by Household Income (2015 - 2017) Length of OTT Service Subscriptions Netflix, Amazon, and Hulu: Average Number of Months Subscribing to Service (Q1/17) Netflix, Amazon, and Hulu: Average Number of Months Subscribing to Service by Generation (Q1/17) Netflix, Amazon, and Hulu: Average Number of Months Subscribing to Service by Income (Q1/17) Lifetime Subscriber Value - OTT Subscription Services (Q1/17) OTT Subscription Cancellation Subscribers Cancelling OTT Service as a % of Current Subscriber Base (2015 - 2017) Netflix, Amazon, and Hulu: Subscribers Cancelling OTT Service as a % of Current Subscriber Base (2015 - 2017) Popular OTT Services: Subscribers Cancelling OTT Service as a % of Current Subscriber Base (2015 - 2017) Netflix, Amazon, and Hulu: Subscribers Cancelling OTT Service as a % of Current Subscriber Base by Generation (Q1/17) Network Specific and Linear OTT Services: Subscribers Cancelling OTT Service as a % of Current Subscriber Base by Generation (Q1/17) Sports vs. Overall OTT Services: Subscribers Cancelling OTT Service as a % of Current Subscriber Base (Q1/17) Monthly Expenditure on Entertainment (Q3/16) Attitudes about Online Video & Pay TV Service (Q1/17) OTT Service Trials & Conversion Per-Trial OTT Trial Success Rate: OTT Trials Resulting in a Subscription (Q1/17) Average Number of Trials and Subscriptions (Q1/17) Per-Household OTT Trial Success Rate: Percentage of Consumers Subscribing to an OTT Service After a Trial (Q1/17) OTT Service Trials by Age (Q1/17) OTT Service Trials by Technology Adoption Segments (Q1/17) OTT Conversion Rate (Q1/17) Demographic Profiles of OTT Trialers That Didn't Subscribe vs. That Did Subscribe (Q1/17) Attitudes About Online Video and Pay TV by OTT Trialers That Subscribed (Q1/17) Appendix Publish Date: 3Q 2017 Slides: 53 Authored By: Brett Sappington - Senior Research Director and Principal Analyst Katherine Li - Data Analyst Yilan Jiang - Senior Director of Consumer Analytics David Mitchel - Research Analyst
Published by Parks Associates All rights reserved. No part of this book may be reproduced, in any form or by any means, without permission in writing from the publisher. Printed in the United States of America.
Disclaimer |