- Smart Home Products and Services
- Global Connected Living
- Residential Security
- Broadband and Entertainment Services
- Smart Energy Management
- CE Devices and Mobility
- Wellness and Independent Living
- Entertainment Content
Consumer Research
Primary ResearchSubscribe TodayThe Parks Points newsletter features all aspects of our research, including smart home, IoT devices, entertainment and digital media, security, energy, health, and consumer data. Subscribe Now | Entertainment Habits on Connected CE Devices
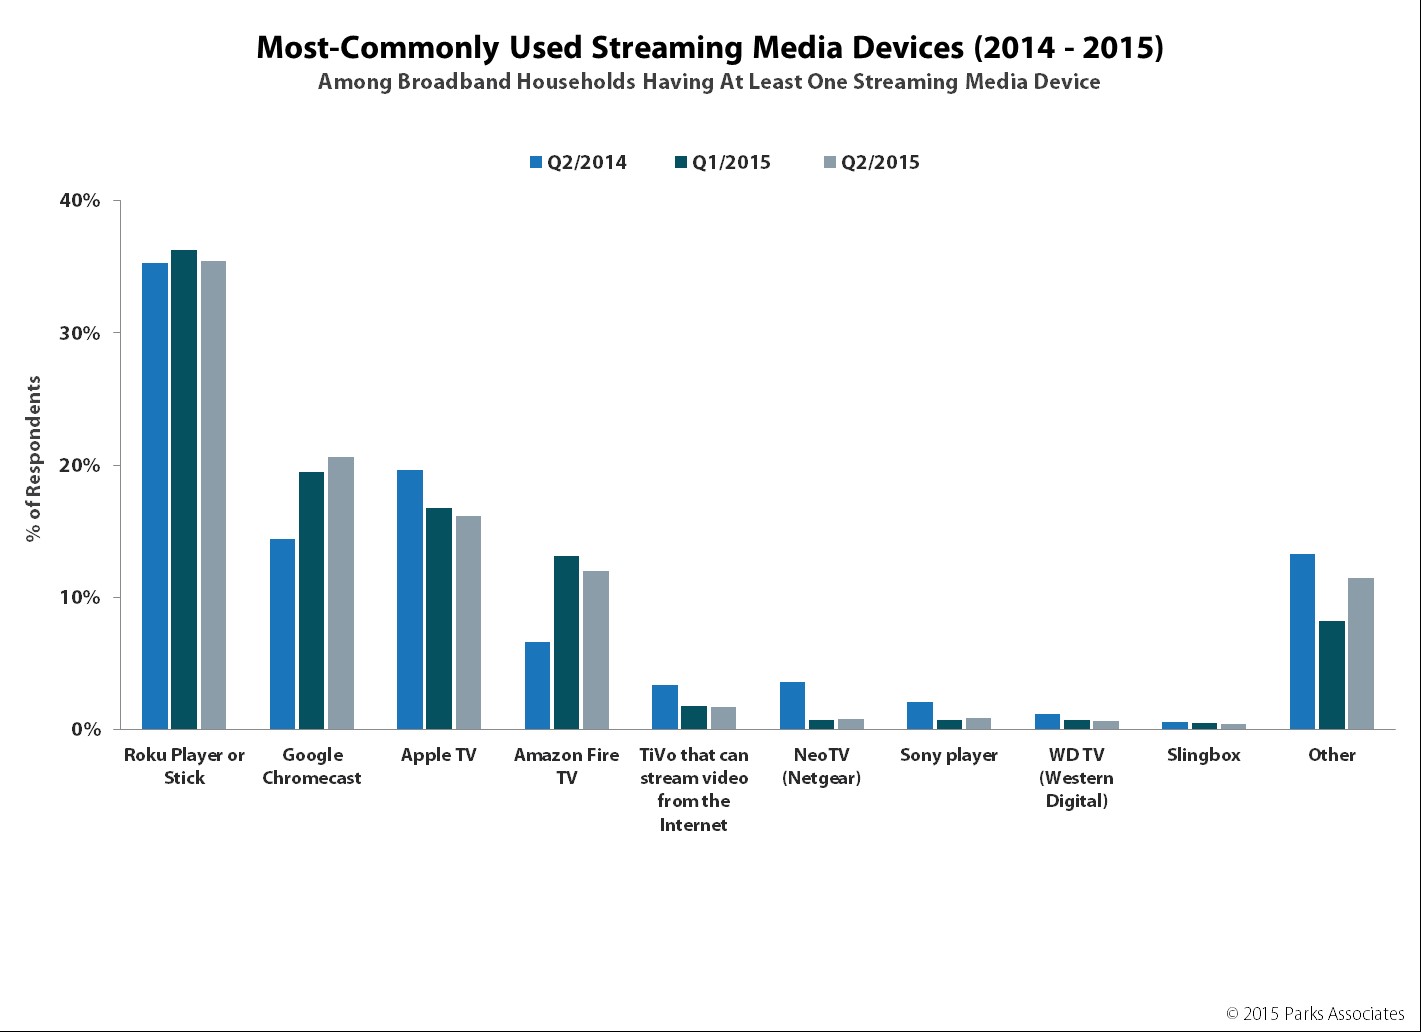
Download Table of Contents (PDF) About the Research Previous Research 360 View: Digital Media & Connected Consumers (Q3/15) The Cost of Piracy (Q2/15) Webisodes and Multichannel Networks: Future Content Opportunities (Q2/15) Consumer Segmentation: Sources and Spending (Q1/15) Consumer Segmentation: OTT Video Buyers (Q4/14) Converging Clouds: The Next Step for the Personal Cloud (Q4/14) Key Findings Industry Insight Recommendations Adoption Trends on Connected CE Devices: % of U.S. BB HHs with Internet-connected In-Home Entertainment Devices (2009 - 2015) % of U.S. BB HHs Connecting In-Home Entertainment Devices to Internet (2012 - 2015) Most-Commonly Used Connected In-Home Entertainment Platform (2014 - 2015) Most-Commonly Used Connected In-Home Entertainment Devices to Access Online Video Content Most-Commonly Used Streaming Media Devices (2014 - 2015) Usage Patterns by Device: Brand of Smart TV Owned (Q1/15) Digital Media Activities by Most Used In-Home Connected Entertainment Device (Q1/15) Digital Media Activities by Most Used Connected In-Home Entertainment Device (Q1/15) Services by Platform: OTT Adoption by Most Used Connected Streaming & Gaming Device (Q2/15) Online Video Authentication (2013-2015) Online Video Authentication by Pay-TV Provider (Q2/15) Pay-TV Subscription by Most Used Connected In-Home Entertainment Device (Q2/15) Pay-TV Adoption by Most Used Connected Streaming Media & Gaming Device (Q2/15) % Using Transactional Services by Most Used Connected In-Home Entertainment Device (Q2/15) % Using Transactional Services by Most Used Connected Streaming Media & Gaming Device (Q2/15) Device Ownership by Cord Cutters: Overall Adoption of Connected In-Home Entertainment Devices by Cord Cutting Status (Q2/15) % of Cord Cutters/Non-Cord Cutters Owning Specified Internet-Connectable Devices (Q2/15) Most Used Connected In-Home Entertainment Device Adoption by Cord Cutting Status (Q2/15) Demographic Comparison of Cord Cutters by CE Device Ownership (Q2/15) OTT Service Use by Cord Cutters with Connected In-Home Entertainment Device (Q2/15) Publish Date: 3Q 2015 Slides: 50 Authored By: David Mitchel - Research Analyst Yilan Jiang - Senior Director of Consumer Analytics Brett Sappington - Senior Research Director and Principal Analyst Glenn Hower - Senior Analyst
Published by Parks Associates All rights reserved. No part of this book may be reproduced, in any form or by any means, without permission in writing from the publisher. Printed in the United States of America.
Disclaimer |