- Smart Home Products and Services
- Global Connected Living
- Residential Security
- Broadband and Entertainment Services
- Smart Energy Management
- CE Devices and Mobility
- Wellness and Independent Living
- Entertainment Content
Consumer Research
Primary ResearchSubscribe TodayThe Parks Points newsletter features all aspects of our research, including smart home, IoT devices, entertainment and digital media, security, energy, health, and consumer data. Subscribe Now | OTT Video Services: Purchasing and Perceived Value
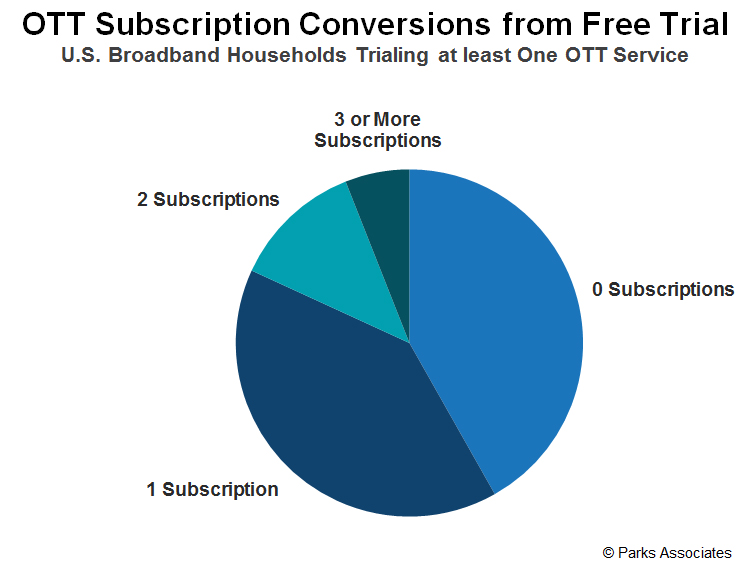
Download Table of Contents (PDF) Consumer Analytics: Access and Entertainment Track Executive Summary Industry Insight Key Findings & Market Impact OTT Service Adoption Overall OTT Service Subscriptions (2016 - 2018) OTT Category Service Subscription (2017 - 2018) Number of OTT Service Subscriptions (2014 - 2018) OTT Service Subscription: Big 3 OTT vs. Non Big 3 OTT (2017 - 2018) OTT Service Subscriptions (2012 - 2018) Top Sports OTT Video Subscriptions (Q3/2018) OTT Service Subscription Package (2016 - 2018) Use of Free / Ad-based OTT Video Services (2017 - 2018) Use of Transactional OTT Services (2017 - 2018) Subscription OTT Service Use vs. Free / Ad-based OTT Service Use (2017-2018) Self-Aggregator Households (Q3/18) Perceived Value of Video Content Most Enjoyed Leisure Activities (Q3/18) Types of Enjoyable Channels/Programming (Q3/18) Service Feature Expectations at Incremental Pricing Testing Consumer Expectations of OTT Service Features OTT Expected Feature at Incremental Pricing: Resolution (Q3/18) OTT Expected Feature at Incremental Pricing: Number of Streams (Q3/18) OTT Expected Feature at Incremental Pricing: Advertising (Q3/18) OTT Expected Feature at Incremental Pricing: Platforms (Q3/18) OTT Expected Feature at Incremental Pricing: Library Updates (Q3/18) OTT Expected Feature at Incremental Pricing: Content (Q3/18) OTT Expected Feature at Incremental Pricing: User Experience (Q3/18) OTT Expected Feature at Incremental Pricing: Service Enhancements (Q3/18) Monthly Expenditure on Video Entertainment Average Household Expenditure on Video Entertainment by Video Sources (2012 - 2018) Average Monthly Expenditure on Non-Pay-TV Video Entertainment (Q3/18) Average Household Monthly Expenditure on Internet Video (2012 - 2018) Average Monthly Expenditure on Subscription OTT Video by Service (Q3/18) Service Trials and Conversions OTT Trials and Conversion – Past Six Months (Q3/18) Number of Trials - Past Six Months (Q3/18) OTT Subscription Conversions from Free Trial (Q3/18) Success Rate by Trialer Type (Q3/18) Number of Service Subscription by Trialer Type (Q3/18) Service Provider Perceptions Reasons for Subscribing: vMVPDs vs. Other OTT Services (Q3/18) Reasons for Subscribing by OTT Service (Q3/18) Top 3 OTT Services Subscribed to by Specific vMVPDs Subscribers (Q3/18) Net Promoter Score: Video Services (Q3/18) Net Promoter Score: vMVPD (Q3/18) Net Promoter Score: Pay-TV Service Operators (2017 vs. 2018) Appendix Publish Date: 1Q 2019 Slides: 59 Authored By: Brett Sappington - Senior Research Director and Principal Analyst Michael Tuck - Researcher Yilan Jiang - Senior Director of Consumer Analytics Pooja Kamble - Researcher
Published by Parks Associates All rights reserved. No part of this book may be reproduced, in any form or by any means, without permission in writing from the publisher. Printed in the United States of America.
Disclaimer |