- Smart Home Products and Services
- Global Connected Living
- Residential Security
- Broadband and Entertainment Services
- Smart Energy Management
- CE Devices and Mobility
- Wellness and Independent Living
- Entertainment Content
Consumer Research
Primary ResearchSubscribe TodayThe Parks Points newsletter features all aspects of our research, including smart home, IoT devices, entertainment and digital media, security, energy, health, and consumer data. Subscribe Now | Pay TV: Perception, Adoption, and Retention
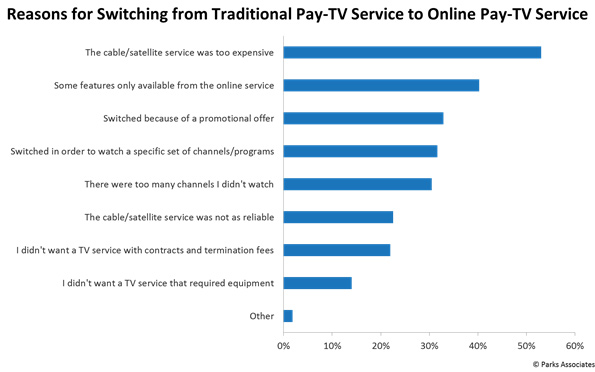
Download Table of Contents (PDF) Executive Summary Industry Insight Entertainment Video Service Ecosystem Pay-TV & OTT Service Subscriptions Pay-TV Subscribers with OTT Subscription Services NPS by Pay-TV Service Type (2018 - 2020) Stand-alone vs Bundled Broadband Service Net Promotor Scores (NPS, 2018 - 2020) Pay-TV Service Features Received Appeal of Potential New Features TV Service NPS by Impact of Set-Top Box or Steaming Media Player High Intention to Make Changes to Pay-TV Plans Likelihood of Pay-TV Cancellation if Less New Content This Year due to COVID-19 Adoption & Perception of Pay-TV Services Pay TV & OTT Service Subscriptions Pay-TV Subscribers with OTT Subscription Services Top Traditional Pay-TV Providers Among Subscribers Pay-TV Adoption by Service Type (2019-2020) Online Pay-TV Service Adoption Adoption of Online Pay-TV Services from Newcomers vs. Traditional Players NPS by Pay-TV Service Type (2018 - 2020) NPS of Top Providers Changes to Standalone and Bundling Among Subscribers Adoption of Bundles and Standalone Services Home Service ARPU (2010 - 2020) ARPU of Home Bundled Services Trends in Home Service Subscription NPS of Pay-TV: Stand-alone vs. Bundled Service (2018 - 2020) Set-Top Box Adoption Set-Top Box Adoption Streaming Media Player Adoption Xfinity Flex Streaming Box/Cox Contour Steam Player Adoption Adoption of Set-Top Boxes with OTT Video Support Among Subscribers to Top Pay-TV Providers TV Service NPS by Impact of Set-Top Box or Steaming Media Player Primary Streaming Devices for Most Used TV Primary Streaming Device for Second Most Used TV Primary Device for Streaming Online Videos Among TV Owners Primary Streaming Devices - Connected TV Products Frequency of Using Connected TV Products Time Spent on Entertainment Activities via Primary Streaming Video Product Average Weekly Hours Spent on Primary Streaming Video Product Adoption of Pay-TV Service Features Video Packages Adoption Pay-TV Service Features Received Monthly Usage of Pay-TV Features and Packages Frequency of Using Video Package Frequency of Using Pay-TV Service Features Appeal of Potential New Features Satisfaction with Traditional Pay-TV Service Providers Value of Specific TV Features Intentions and the Effects of COVID-19 Services Used During COVID-19 Crisis Intention to Use Services After COVID-19 Changes Made to Pay-TV Service Over 12 Months Prior to Survey Reasons for Switching from Online Pay-TV Service to Traditional Pay-TV Service Reasons for Switching from Traditional Pay-TV Service to Online Pay-TV Service Expected Entertainment Spending During 2020 Holidays Likelihood of Making Changes to Pay-TV Plans High Intention to Make Changes to Pay-TV Plans High Intention to Churn By Online Services Likelihood of Pay-TV Cancellation if Less New Content This Year due to COVID-19 Importance of Live Sporting Events to Keep TV Service Preferred Method to Watch New Movies Publish Date: 1Q 2021 Slides: 65 Authored By: Kristen Hanich - Director of Research Yilan Jiang - Senior Director of Consumer Analytics Xiaofan Tan - Consumer Insights Analyst II
Published by Parks Associates All rights reserved. No part of this book may be reproduced, in any form or by any means, without permission in writing from the publisher. Printed in the United States of America.
Disclaimer |